Adnan A Kadi1,
Ali S Abdelhameed1 ![]() ,
Hany W Darwish1,2,
Mohamed W Attwa1,
Ahmed H Bakheit1
,
Hany W Darwish1,2,
Mohamed W Attwa1,
Ahmed H Bakheit1
For correspondence:- Ali Abdelhameed Email: asaber@ksu.edu.sa
Received: 26 June 2016 Accepted: 12 November 2016 Published: 21 December 2016
Citation: Kadi AA, Abdelhameed AS, Darwish HW, Attwa MW, Bakheit AH. Liquid chromatographic-tandem mass spectrometric assay for simultaneous quantitation of tofacitinib, cabozantinib and afatinib in human plasma and urine. Trop J Pharm Res 2016; 15(12):2683-2692 doi: 10.4314/tjpr.v15i12.21
© 2016 The authors.
This is an Open Access article that uses a funding model which does not charge readers or their institutions for access and distributed under the terms of the Creative Commons Attribution License (http://creativecommons.org/licenses/by/4.0) and the Budapest Open Access Initiative (http://www.budapestopenaccessinitiative.org/read), which permit unrestricted use, distribution, and reproduction in any medium, provided the original work is properly credited..
Purpose: To develop a simple, adequately sensitive, and practical liquid chromatographic-mass spectrometric method to simultaneously quantify three tyrosine kinase inhibitors, viz, tofacitinib (TOF), cabozantinib (CBZ) and afatinib (AFB) after their extraction from both human plasma and urine.
Methods: Blood and urine samples were obtained from healthy volunteers who admitted to not being on any medications. The investigated analytes were chromatographically separated on a C18 column (Luna®-PFP 100Å column, 50 mm × 2.0 mm i.d., 3.0 µm) with the aid of a mobile phase containing A; acetonitrile (ACN) and B; 0.01 M ammonium formate buffer (pH 4.1) pumped at a rate of 0.3 mL.min-1 in the ratio A:B, 50:50 v/v. Analyte monitoring was achieved by tandem mass spectrometry interfaced with an electrospray ionization source with the aid of multiple reaction monitoring (MRM) mode for analytes quantification.
Results: The proposed method permitted a specific and sensitive determination of the investigated TKIs in the linear range of 1.0 - 100 ng mL-1 with correlation coefficient (r2) of 0.9991, 0.9997, and 0.9998 for TOF, CBZ and AFB, respectively. The method was validated with regard to its limits of quantification (ranging from 0.91 to 1.24 ng mL-1 for the 3 analytes), intra- and inter assay accuracy (in the range -1.85 to 1.22 %) and precision (0.71 - 5.12 %). The method was also validated in terms of recovery from both studied matrices, robustness and matrix effect.
Conclusion: The results obtained reveal that the developed method is simple, specific and highly efficient for routine determination of the studied analytes in human plasma and urine. It can be reliably applied for high throughput analysis of clinical samples containing the investigated analytes.
Introduction
Tyrosine kinases (TKs) are deemed potential targets for new drug development, especially for cancer and rheumatoid arthritis drugs. Over the last decade, several tyrosine kinase inhibitors (TKIs) have been developed and approved for the treatment of various types of cancer, with each of them targeting specific signaling pathways [1,2]. Furthermore, more recent advances have also led to the discovery of the Janus kinases (JAKs) [3], which by their inhibition introduced new therapeutic approach for cancer and immunity disorders [4].
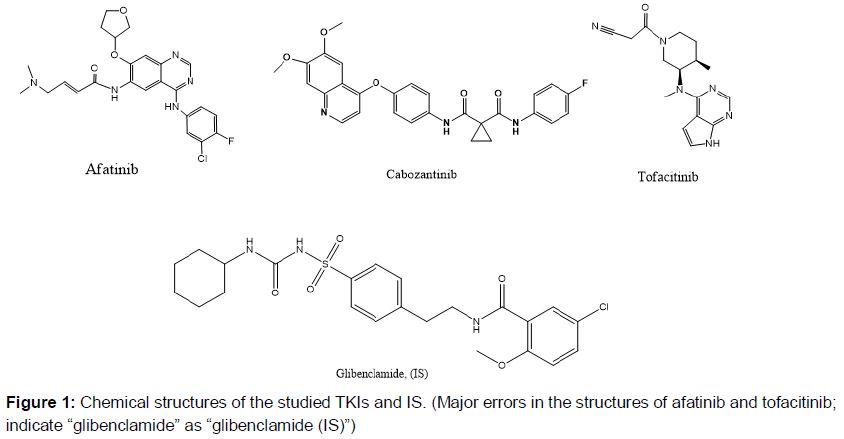
In the current study a simple analytical procedure was designed to be able to simultaneously quantify various TKIs in human plasma, hence, three FDA approved medications were selected as representative examples of the TKIs acting on the different kinases. Firstly, afatinib (AFB; a), a selective TKI that blocks the signaling pathways from the receptor tyrosine kinases HER1 (EGFR/ErbB1), HER2 (ErbB2), and HER4 (ErbB4) [5]. In 2013, the U.S. FDA approved the drug to be used with patients suffering of locally advanced or metastatic non-small cell lung cancer (NSCLC) with their tumors showing EGFR (epidermal growth factor receptor) mutations either as deletions of exon 19 or substitution of exon 21 [6].
The second chosen TKI representative is cabozantinib (CBZ; b)), which is also an orally active agent that blocks the activity of different tyrosine kinases including mesenchymal–epithelial transition factor (MET) and vascular endothelial growth factor receptor types 1 (VEGFR-1), 2 (VEGFR-2), and 3 (VEGFR-3) [7]. In 2011, the U.S. FDA approved CBZ for the management of patients with progressive, metastatic medullary thyroid cancer; in 2015 it was also approved by the European Medicines Agency (EMA) for the same use. The last chosen kinase inhibitor is tofacitinib (TOF; c), which is a representative of the Janus kinase inhibitors (JAKIs). TOF is reported to selectively block the signaling pathway involving the kinases JAK 1 and 3 [8]. TOF was approved by the U.S. FDA in 2012 for the management of patients with moderate to severe rheumatoid arthritis (RA) either alone or to be taken with methotrexate in more sever un-responsive cases [9].
Screening of the literature disclosed few published reports for the quantification of AFB, CBZ, and TOF either alone or in combination with other medications. Determination of AFB alone was reported in two recent studies in human plasma using UPLC-DAD [10], LC-MS [11], with two other liquid chromatographic procedures published for its quantitation in tablets [12,13]. Moreover, one recent study reported AFB simultaneous determination with other TKIs namely, vandetanib, pazopanib, and dasatinib in human plasma using HPLC-DAD [14] with the AFB linearity range 0.7 - 7.0 µgmL-1, which is higher than its reported Cmax (maximum plasma concentration) value of 6.19 - 7.58 ngmL-1 [11] and 11.6 - 40.8 ngmL-1 after administration of single and multiple doses of different AFB concentrations [15]. On the other hand, individual CBZ quantification was reported using HPLC-UV [16], LC-MS/MS [17,18] in rat plasma with one study using micellar enhanced spectrofluorimetry in human plamsa [19].
The reported Cmax of CBZ-depends mostly on its dose, which was in the range of 34.2-603 ngmL-1 after oral administration of 0.08 mgkg-1 to 1.28 mgkg-1. Ultimately, with its lowest reported observed plasma concentration ~ 81 ngmL-1 [20], quantitative determination of TOF alone was reported using HPLC-UV in rat plasma [21], for its enantiomers separation [22], using LC-MS alone [23], and in combination with methotrexate in rat plasma [24].
Hence, to date no study has been published for the determination of AFB, CBZ, and TOF although, as per clinical decisions, TOF as an anti-rheumatoid arthritis therapy may be administered with AFB or CBZ or any other TKI in patients suffering both diseases. This study is therefore conducted to establish and comprehensively validate a new LC-MS/MS method to simultaneously quantify AFB, CBZ, and TOF in human plasma under their plasma concentration levels.
Methods
Chemicals and reagents
Reference standards of AFB, CBZ, and TOF of > 99 % purity were acquired from Weihua Pharma Co. Ltd (Zhejiang, China). Ultrapure solvents and reagents of HPLC-grade were obtained from Merck BDH Ltd. (Poole, U.K). Blood samples were obtained from King Khaled University Hospital (King Saud University, Riyadh, KSA), following informed consent was acquired, fasting blood specimen were collected, plasma was then separated and stored frozen at -70 °C. Human urine was obtained from healthy male volunteers who admitted to not being on any medications. The ethics review committee of the College of Pharmacy, King Saud University, Riyadh, Saudi Arabia approved the study protocol (approval no. 14370511), which followed the international ethical guidelines for biomedical research involving human subjects [25]. A Milli-Q plus water purification system (Merck Millipore, MA, USA) was used to produce ultra-pure water ≥ 18.2 MΩ that was used throughout the study.
Instrumentation and conditions
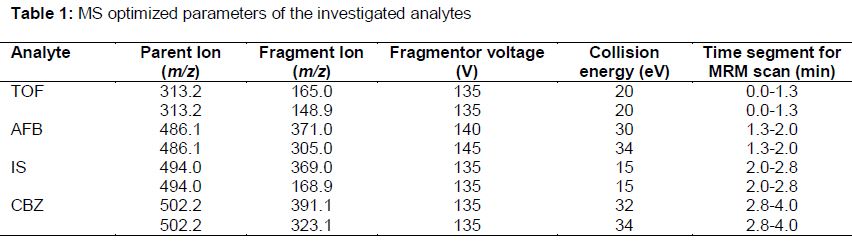
Chromatographic resolution of the analytes was executed through an Agilent 1200 HPLC system with their quantitative determination carried out using an Agilent 6410 triple quadrupole (Agilent Technologies, CA, USA). Analytes chromatographic elution was accomplished utilizing a mobile phase containing solvents A; Acetonitrile (ACN) and B; 0.01 M ammonium formate buffer (pH~4.1) pumped binarily at 0.3 mLmin-1 in the ratio A:B, 50:50 v/v. A C18 column (Luna®-PFP 100Å column) (50 mm × 2.0 mm i.d., 3.0 µm) (Phenomenex Inc., CA, USA) was used for the analytes separation at ambient temperature. Following their elution, analytes were sprayed into the mass spectrometer using an ESI (electrospray ionization) interface running in the positive ionization mode with the ESI temperature set to 350 oC. Low and high purity nitrogen gas were used as desolvation gas flowing at 12 Lmin-1 and neubilizer gas with a pressure of 55 psi, respectively. Capillary voltage was set to 4 kV and a Dwell time of 200 ms was maintained, for all ions. All separation and detection parameters were adjusted to augment the chromatographic resolution and mass spectrometric response. The optimized MS parameters for individual parent and daughter ions are listed in . A MassHunter software (Agilent Technologies, CA, USA) was used throughout the study to control the LC-MS system and to acquire the data.
Preparation of standard solutions
AFB, CBZ, TOF, and IS Standard solutions of 200 µg mL-1 were freshly prepared in methanol at room temperature. Further dilutions were carried out using methanol to achieve 10 µg mL-1 working solutions. Further dilutions of each analyte were attained in mobile phase to prepare calibration and quality control (QC) samples.
Calibration curves samples for plasma and urine
Calibration curves were constructed in both spiked drug-free human plasma and urine with AFB, CBZ, and TOF concentrations in the concentration range 1.0 - 100 ng mL-1. Aliquots of 100 µL of AFB, CBZ, and TOF were spiked into 1 mL of human plasma/urine and appropriate volumes were then mixed with 350 µL of 0.1 M glycine buffer (pH ~9.0).
A volume of 50 μL of IS (200 ng mL-1) was added and subsequent liquid-liquid extraction was performed to those samples via the addition of diethyl ether (4 mL) succeeded by separation and evaporation of the organic phase under a gentle stream of nitrogen. Residues were reconstituted in mobile phase and filtered through a 0.45 μm Millex filter (Millipore, MA, USA). Additionally, three quality control samples of 7.0, 50, and 80 ng mL-1 and three solutions for incurred sample reanalysis (ISR) with concentrations of 10, 50, and 100 ng mL-1 were prepared in human plasma only. Blank plasma/urine samples were similarly treated with ultrapure water replacing the analytes solutions.
Calibration curve construction
Three calibration graphs of each analyte in both plasma and urine, were executed by plotting peak area ratio of each analyte to IS against the corresponding analyte concentrations using 1/X2 as a weighing factor. Calibrator response functions and choice of regression analysis were chosen by evaluating the percentage relative error (% RE) for all calibrators as described by Almeida et al [26].
Method validation
Specificity
The method specificity was investigated via the analysis of 6 blank plasma/urine samples processed according the proposed procedure. The injected samples were subsequently examined for any elution interference compared to the analytes samples either in plasma or urine.
Linearity and sensitivity
Three different calibration graphs were plotted for plasma and urine samples, and were used to determine the method‘s linearity and sensitivity. Limit of detection (LOD) and lower limit of quantification (LLOQ) were estimated via equation 1, using the calibration curve slope (b) and standard deviation of the intercept (SD0).
LLOQ or LOD = kSD0/b ………………….. (1)
where k is 10 for LLOQ and 3.3 for LOD
Precision and accuracy
Intra- and inter-day assessments of both accuracy and precision were performed through the analysis of the QC samples 3 times in a single day and over 3 consecutive days, respectively. The coefficient of variation percent (%CV) was used as an indication of precision and was calculated as per equation 2 using the calculated mean and standard deviation values of each sample determination.
(%CV) = [SD/M] x 100 .................…………. (2)
where M is the mean measured concentration. Percent error (% error) was used to refer to the accuracy of those samples determinations and computed following equation 3.
% Error = [(M-N)/N] x 100 ............................ (3)
where N is the nominal concentration.
Furthermore, the 3 ISR samples were assessed and their mean concentrations were calculated and set as initial values (I), a week later those samples were reanalyze yielding their “repeat values”. The difference (% D) in ISR samples was then computed as in equation 4.
% D = [(I-R)/V] x 100 .................................. (4)
where V is the mean of initial and repeat values of each sample.
Recovery and matrix effect
Analytes recovery was determined in both matrices to infer the extraction efficiency of the current procedure. Recoveries were evaluated by comparing the mean peak area ratio of each analyte to IS in the extracted QC samples to those extracted from blank plasma and urine, which were exposed to post-spiking with the respective reference solutions.
For calculation of absence of matrix effect (% A) for both matrices, Eq 3 was used.
%A = (B/C) x 100 ............................ (5)
where B and C are the mean peak area ratio of plasma/urine samples and aqueous samples, respectively.
Robustness
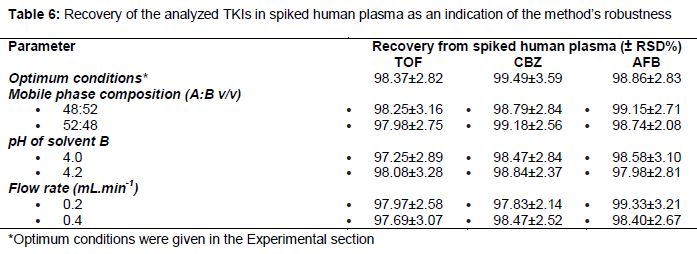
Robustness of the proposed analytical procedure was investigated by examining the influence of individual modifications/changes within the analytical settings around the proposed optimum value in the current procedure. Those inter-varied parameters reflect probable alterations occurring in diverse test environments. The modified mobile phase parameters were the composition ratio of A and B, flow rate, and pH of solvent B.
Results
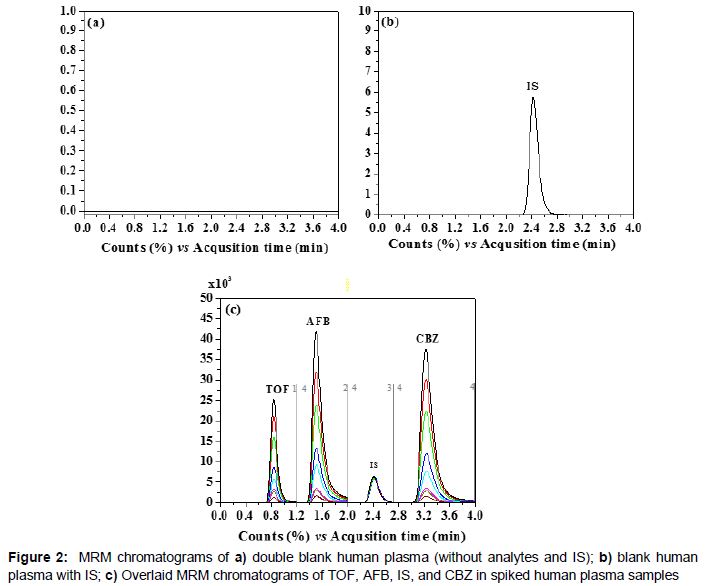
MRM chromatograms representing plasma samples of the analytes under the aforementioned chromatographic and mass spectrometric conditions are shown in .
Validation results
Specificity
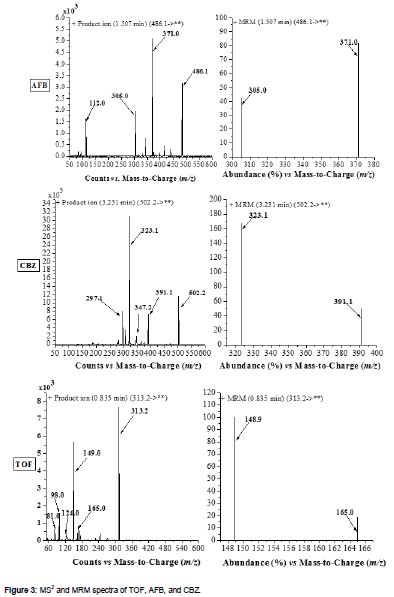
demonstrates the MS spectra produced during the product ion (MS2) and MRM scans of the investigated TKIs. Hence, the current method was proved specific with the absence of interfering signals in blank plasma samples within the elution time period of the analytes.
Linearity and sensitivity
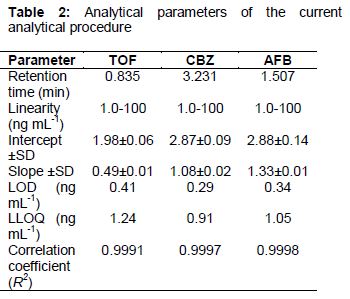
Calibration curves in both plasma and urine samples of the studied TKIs provided linear relationships with low standard deviations for all calibration. summarizes the different analytical parameters including the LOD and LLOQ, which were computed to be below the reported Cmax values [15,20,27] of the studied TKIs.
Precision and accuracy
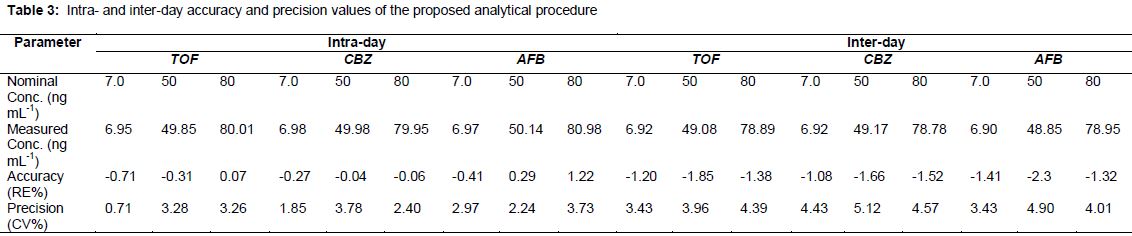
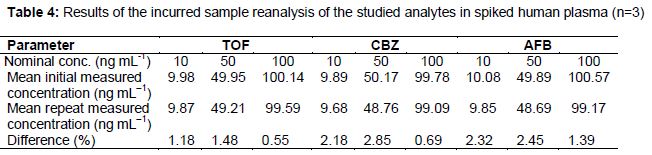
Accuracy and precision of the present method were evaluated on intra- and inter- day basis as previously described, the results listed in proved the method’s efficiency with the demonstrated low CV% and RE. In a similar vein, 3 concentrations of 10, 50, and 100 ng mL-1 of the studied TKIs in spiked human plasma were assayed for incurred sample re-analysis and clearly shows that their results confirmed the current method reproducibility.
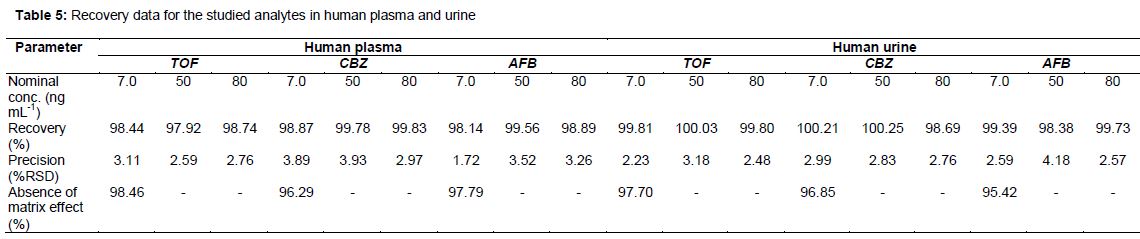
Effect of different matrices on analyte recovery
Recovery data of the investigated TKIs were computed and are listed in . Moreover, and for further confirmation of the absence of any matrix effect, two groups of three samples of blank plasma and urine were extracted and then spiked with the lowest QC concentration of the analytes (i.e. 7.0 ng mL-1) and the IS. Concomitantly, another group with three samples of the same concentration and IS in aqueous solution (i.e. in mobile phase) was prepared. The different sample groups were analyzed and the absence of matrix effect percent was evaluated and listed in .
Robustness
Robustness was expressed by the relative standard deviation of the recovery results obtained from triplicate analysis of the studied TKIs in spiked human plasma with the inter-varied analytical parameters. demonstrates the current method robustness showing the results acquired following the modification of the investigated parameters from their optimum values according to the current analytical procedure.
Discussion
Preliminary chromatographic and mass spectrometric optimizations were carried out in terms of mobile phase composition, flow rate, pH of the mobile phase, MRM transitions, etc. Subsequently, a mobile phase composed of ACN (A) and 0.01 M ammonium formate in water (pH ~ 4.1) (B) (A:B, 50:50, v/v) was chosen for analytes separation and elution at a flow rate of 0.3 mLmin-1. The use of MRM scanning protocol has enhanced the quantitative sensitivity of the method and eliminated any interference arising from the effects of the different matrices during the analytes elution. Following method development, the proposed method was validated according to the International Conference on Harmonisation (ICH) [56,57] and the U.S. Food and Drug Administration (FDA) guidance [58]. Validation was conducted with regard to specificity, linearity, sensitivity, intra- and inter-day accuracy and precision, robustness, and recovery from the both human plasma and urine. The recovery results clearly demonstrate the absence of endogenous matrix interference as the matrix effect is inferred if the ratio is < 85 or >115 % [28].
Conclusion
A rapid, specific and sufficiently sensitive LC-MS/MS method has been successfully developed and validated for the simultaneous quantification of the tyrosine kinase inhibitors TOF, CBZ, and AFB in human plasma and urine. The developed protocol allowed linear fitting of the analyte concentration with peak area ratio in the range of (1.0 - 100 ng mL-1) for all analytes. LLOQ values are 1.24, 0.91 and 1.05 ng mL-1 for TOF, CBZ, and AFB, respectively. The developed method is simple and efficient and can be used in pharmacokinetics studies as well as in the monitoring of the investigated analytes in body fluids.
Declarations
Acknowledgement
References
Archives


News Updates